Frequently Asked Questions About LineSlip Part Two
As we’ve heard repeatedly, buying new software is a daunting task. Will the software actually do what was promised? Will the software help solve the original issues you were having? Will it make a big enough difference to justify the investment?
When risk and insurance professionals inquire about LineSlip, we tend to get similar questions across our demos. In “6 Frequently Asked Questions About LineSlip”, we answered some frequently asked questions we typically receive so you could get a better understanding of the LineSlip platform.
In today’s blog, we will be answering additional frequently asked questions we hear, so you will feel equipped with the necessary knowledge to make the best business decision for your risk department.
1. Can I enter data myself?
A question that we often receive is, “Can I enter data myself?” The answer to this question is no, you cannot.
The reason for this is that we use advanced technology, such as our machine learning capabilities, to pull data from source documents. Once the data is extracted from the source documents, we have our team of internal insurance experts review the data to make sure it’s accurate as possible.
We essentially want to avoid manual keying from our customers to ensure the accuracy and validity of the data and make sure they are consistent with the source documents you provided us. However, if there is a chance that something is missing or wrong, you can always let our team know, and we can make the change for you in the system. Accuracy is of the utmost importance to us, and it’s something we highly value here at LineSlip!
2. Can we see how much premium was spent year over year?
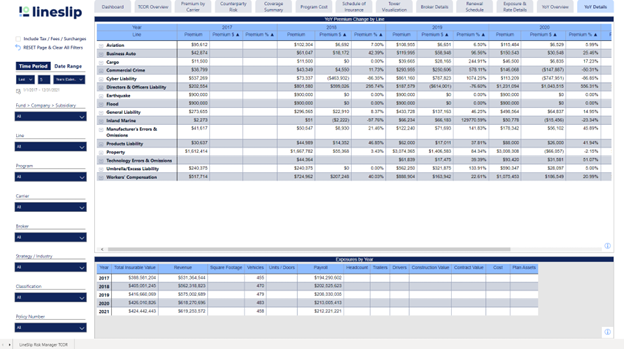
Oftentimes, you’ll want to see a comparison of your year-over-year premium. There are 3 ways you can view how much your premium was spent year-over-year in LineSlip, all of which are found in the LineSlip Risk Manager TCOR Analytics dashboard:
LineSlip Risk Manager TCOR Analytics dashboard
1. The first way is by the Year–Over–Year (YoY) Overview tab.
2. The next way is through the Year-Over-Year (YoY) Details tab.
3. The last way is through the Program Costs tab.
3. How can I view the spend and limits between my multiple entities?
If you work at a large organization, you may be the parent company to many subsidiaries. When you’re reviewing your insurance spend and coverage, you’ll want to account for these entities.
If you want to view the year-over-year spend for your entities, you can view it in the Fund Analytics dashboard.
Fund Analytics Dashboard
From the dashboard, you can click on YoY Overview.
YoY Overview
Next, click on View YoY Detailed Data By Company on the left-hand side to see the data breakout.
View YoY Detailed Data By Company
To recap, the general pathway is Fund Analytics > YoY Overview > View YoY Detailed Data By Company.
Another way to see how much premium was spent for each entity is through the Spend Detail tab. The pathway for this is Fund Analytics > Spend Detail.
Spend Detail tab
As for the limits for your multiple entities, you can also view this through the Fund Analytics dashboard.
You can click the Coverage Summary tab, where a list of the line of coverage and limits for the entities will appear.
Coverage Summary tab
The pathway for this would be Fund Analytics > Coverage Summary.
We hope that this gives you a better understanding of our product and clears up any lingering questions you may have. If you have additional questions, please reach out by emailing us at info@lineslipsolutions.com or through our website chat feature. We’ll be happy to answer any questions you may have.


%20Details%20tab.png)


%20(6).png)
%20(11).png)